KPI,
metrics,
Customer experience,
Customer service analytics,
Published on Fri Sep 11 2026
Updated on Fri Sep 18 2026
16 minute read
When a single negative interaction sends more than 50% of customers to a competitor, CX is make-or-break for every brand. From goal and lever metrics to leading and lagging indicators, experience stats like customer satisfaction (CSAT) and net promoter score (NPS) to efficiency measures like average resolution time, team health factors, and even AI-powered customer service KPIs, learn everything you need to track to assess your customer service’s contribution to your strategic priorities.
We’ll also cover how to interpret your results and how to improve them, including all the formulae, industry benchmarks, and counterintuitive quirks you’ll need to pick up early warning signals and prevent disasters, detect and standardise hidden wins, boost agent and customer satisfaction, and even glean the frontline insights behind your PR team’s best crisis response or your product team’s market-disrupting breakthrough. Dive in to discover the data transforming CX into a self-optimising engine for growth and ROI.
There are as many reasons to track CX as there are to enhance it. Chief among these are revenue considerations. Customer experience and support data helps your brand protect its bottom line through retention, where even a 5% boost increases profitability by around 25%, per Bain & Company. Exceptional CX also drives 140% more spending, whether through value-adding activities like sales and upgrades or loyalty that boosts customer lifetime value. Optimizing resource and cost efficiency is another motivation. Precise KPIs pinpoint where automation is needed, where agents require further training, and where self-service works to save time and spend without compromising CX. In addition to strengthening the positives, KPI tracking and quick, careful responses establish an early warning system that flags and stops churn, compliance failures, security threats, new release glitches, and more via a frontline pulse on customers’ journeys. Yet another application is flagging and fixing team health and development issues to keep top talent on board - as well as building data-driven arguments that get entire organizations aligned.
But collecting more CX data than ever comes with risks. One is analysis paralysis, where too many figures crowd dashboards, cause fatigue, and make crucial info hard to spot. Another is a data operation that drains more resources from your business than its insights generate. The key is constructing a targeted and actionable data strategy in line with evolving business goals. Desired outcomes are often universal, but this season’s number one focus will differ by sector, size, and stage. Before selecting CX KPIs, first get clear on your performance priorities - whether you’re a startup investing heavily in satisfaction and word-of-mouth promotion or a multinational seeking efficient support at scale. Then, make sure you understand these key CX data principles:
Often used synonymously, customer service metrics and KPIs are separated by a crucial distinction. A is , from ticket volume to page clicks or employee satisfaction scores.
No external list can determine your unique brand’s KPIs. Instead, here are the most valuable customer service metrics to choose from according to your customer service data strategy. Grouped according to the core categories of experience and revenue goals as well as efficiency levers and financials, team health and forward-looking AI indicators - this breakdown provides the formulas, industry benchmarks, and interpretation tips you’ll need to implement them effectively.
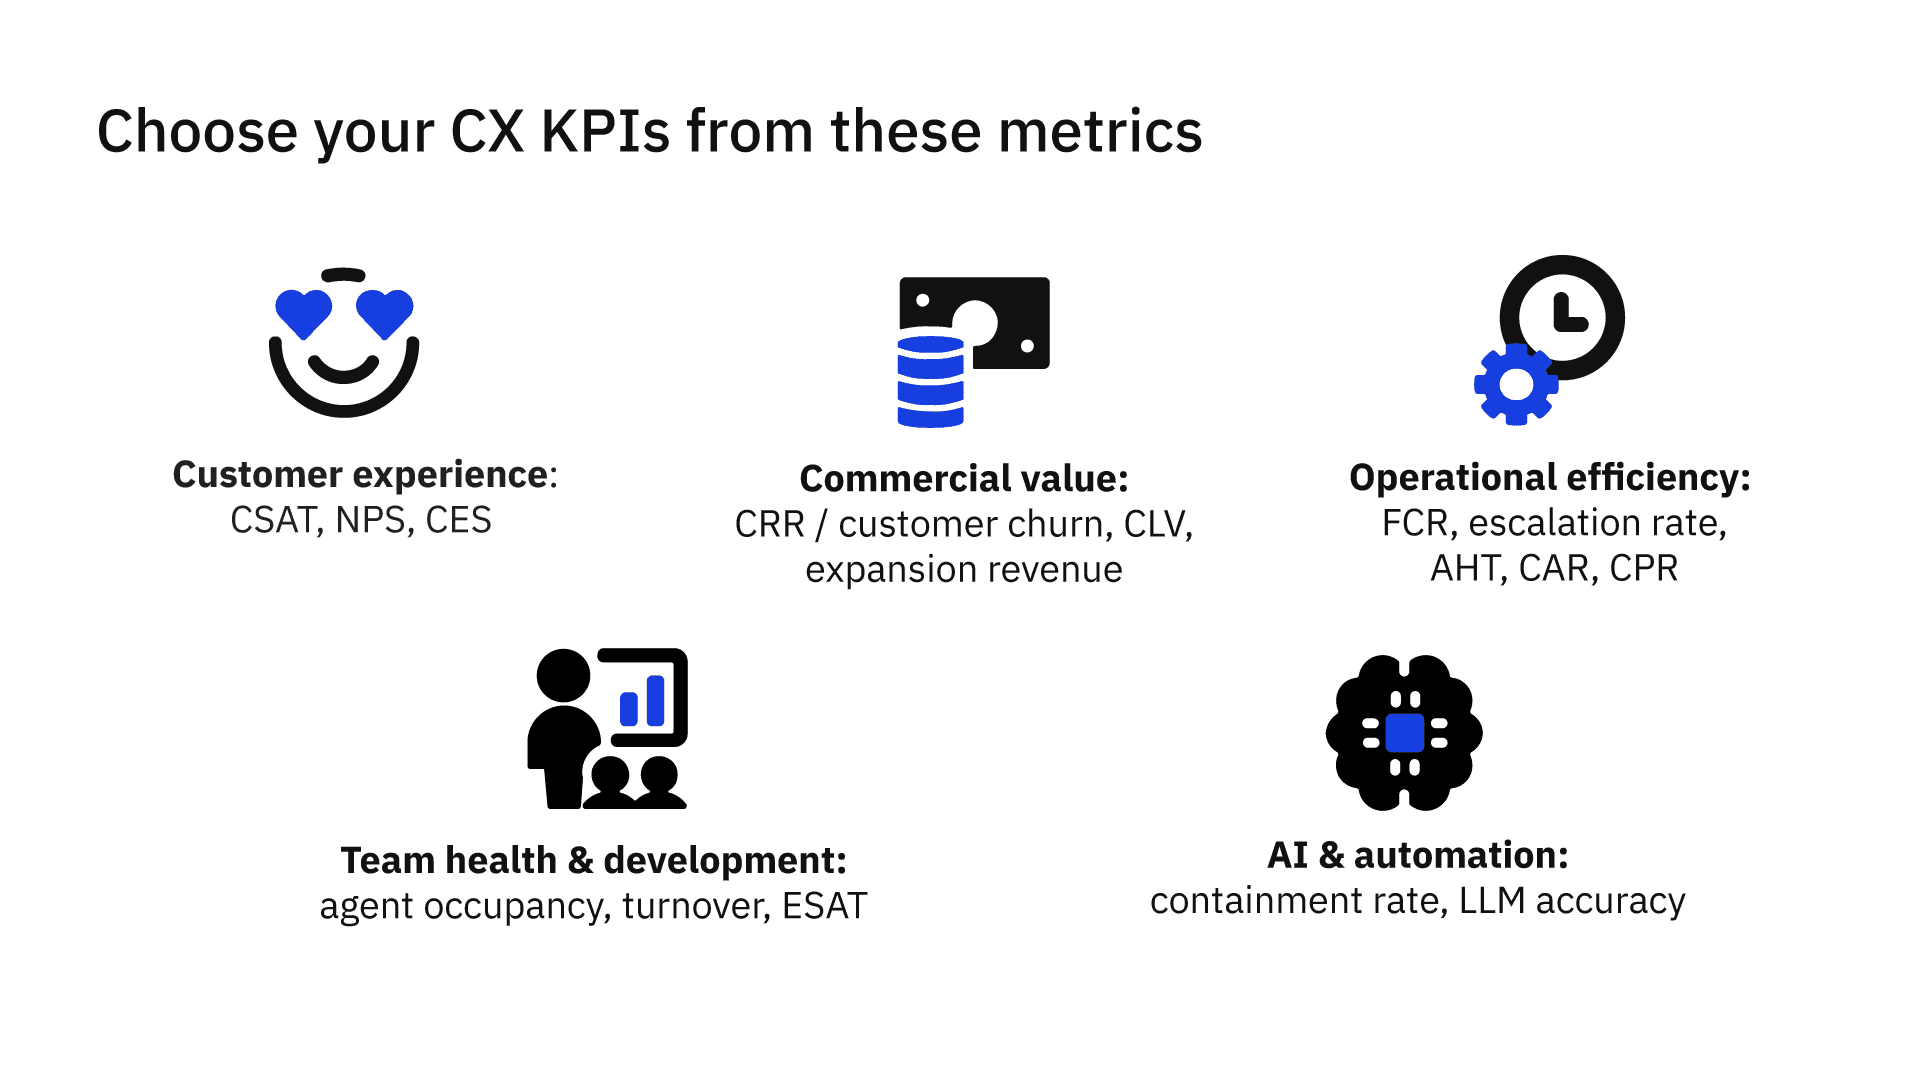
This first set of KPI candidates corresponds to what is typically your support operations’ ultimate goal - loyal, satisfied, actively engaged, and proactively promotive customers offering your business the maximum value. These are typically lagging indicators, downstream of more technical levers. While commercial indicators are easier to quantify, the experience metrics gathered through post-interaction surveys are more challenging. This is often where your team stands to gain the most clarification and breadth by implementing real-time, AI Insight analytics.
With few exceptions, it pays to include all of the following on your dashboard:
Customer satisfaction score (CSAT).
This measures a customer’s happiness with your support immediately following a specific interaction, usually in response to a follow-up survey. To calculate it, apply the formula:
(Positive survey responses / total survey responses) x 100
The answer reflects the percentage of customers immediately satisfied with their experience with your brand. Benchmarks vary substantially by sector: SaaS companies target 92% to ensure continuity of high-value contracts, retailers aim for 82%, healthcare tends to sit at 81%, and financial services target 80%. Investigate your sector’s average - a function of competitiveness, service complexity, and more - and aim well above it, especially when establishing your brand’s initial following. tends to signify a worth digging into.
Collecting data across your commercial goals, efficiency levers, and team health indicators is only the first step. To truly transform your operations, these metrics must feed into a continuous, self-optimising feedback loop. When a lagging goal indicator like customer churn or NPS dips, your team should immediately cross-reference it with leading efficiency levers like first response time or agent occupancy to diagnose the root cause. This interconnected approach allows you to continuously calibrate your AI containment strategies, update your live agent training, and refine your overarching strategy. In addition, while industry and niche benchmarks are essential, keep in mind that there is no better comparison than your own past performance.
If you rely on an external partner to manage these complex omnichannel workflows, structuring this exact feedback loop becomes even more critical. To learn exactly how to apply these KPI families to an outsourced team and ensure maximum ROI, explore our complete guide on how to evaluate BPO performance.
Tracking the right customer service KPIs is both an operational necessity and a strategic brand imperative. When you successfully balance high-level commercial goals like customer lifetime value with granular efficiency levers like first contact resolution and modern AI containment indicators, your contact centre stops being a reactive cost centre. Instead, it becomes a proactive revenue engine. But as the automation paradox proves, navigating this evolving data landscape requires more than a populated dashboard. It demands a sophisticated understanding of human and technological dynamics, real-time root cause analysis, and a relentless commitment to acting on what the data reveals.
Ready to stop drowning in raw data and start driving measurable ROI? We’ve got all you need to integrate intelligent routing, protect your FCR, deploy conversational analytics that uncover hidden churn risks, and empower your frontline through next-generation AI simulation training. Contact Transcom to learn how we can optimise your operations and transform your brand’s CX into your greatest competitive advantage - together.

Created at Thu Sep 17 2026
6 min read
Something happens when a technology concept outpaces the terminology we have to describe it. Across the customer experience landscape, vendors start applying the same label to wildly different things. For instance, industry leaders start buying into the AI label instead of its real operational capability. And somewhere between the pitch deck and the production environment, the real question gets lost: does any of this actually address a real operational need? Agentic AI has reached that stage.
Key performance indicators (KPIs), on the other hand, are the subset you choose to target according to your priorities. The clearer your goals, the more specific and practical they’ll be. From the full list to come, it's best to focus on 5-10 critical metrics based on how many your brand has the capacity to actually act upon. These should be balanced across goals and levers, as well as leading and lagging indicators.
Grouping your data into desired outcomes, or goals, and the operational levers that get you there, is crucial to successful action. If you want to boost customer satisfaction and therefore retention, you might track call duration hoping shorter interactions mean happier customers. But conflating this with your goal could push agents to rush, hitting tight time targets while leaving customers frustrated.
As a rule of thumb, experience metrics like CSAT tend to be goals, with efficiency metrics - like average handle time, first response time, etc. - often serving as levers. However, the distinction, again, ultimately depends on careful and clear selection according to your priorities.
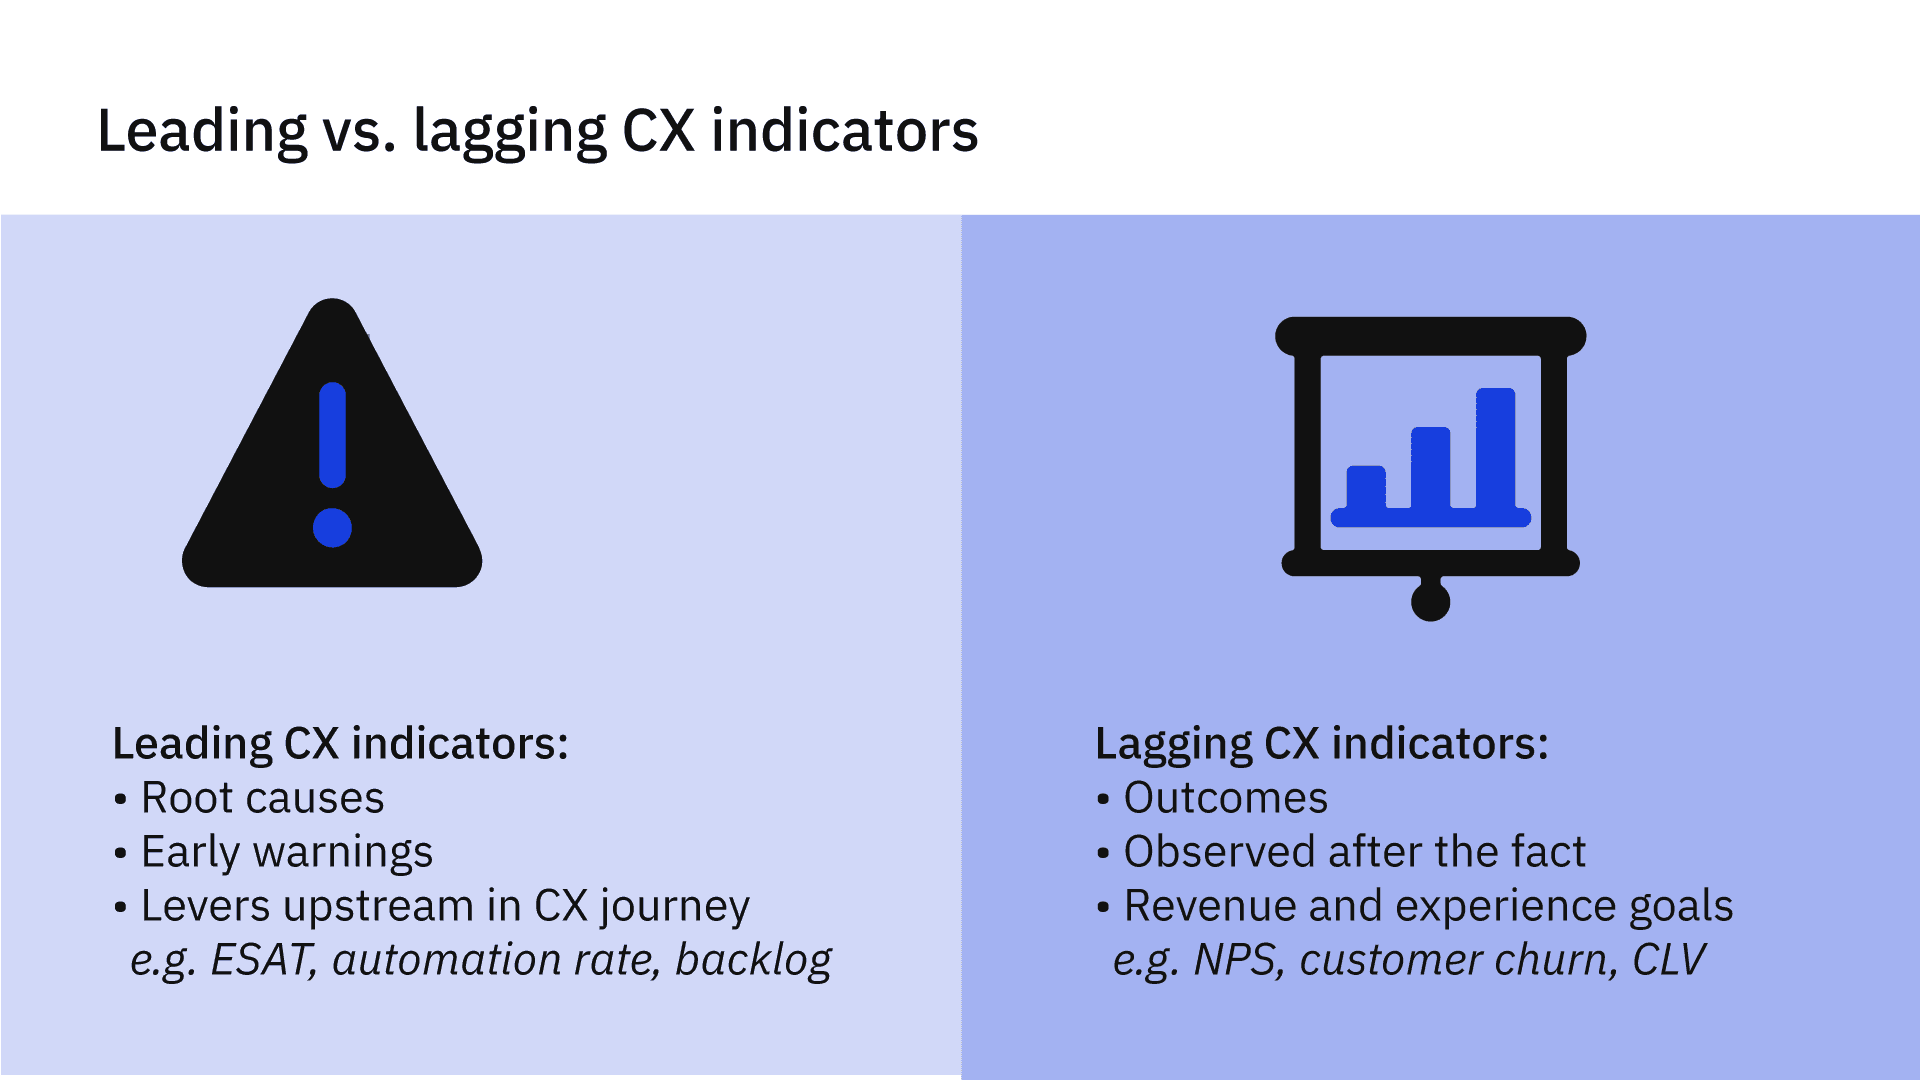
Closely related but less subjective is the difference between leading and lagging metrics. Lagging indicators are backward-looking outcomes that present you the results of what has already happened, such as a drop in your customer retention rate (CRR) or a low monthly NPS average - caused, for example, by poor automated responses in the previous period.
Leading indicators, conversely, are warning signs that predict future outcomes and empower you to make proactive improvements. For example, a spiking agent occupancy rate or a mounting ticket backlog are leading indicators that will inevitably result in agent burnout, missed SLAs, and poor service down the line. Tracking a balance of both allows you to intervene and pivot before a lagging indicator permanently dips.

When creating your CX assessment strategy, remember that even the best KPIs can only tell you so much. With a large enough sample size and detailed stratification - by communication channel, customer type, agent tenure, and more - rich quantitative data can reveal an accurate story of what happened and what you can expect if this continues. Determining causality, e.g., knowing exactly why an interaction soured and what to change, is much harder.
NPS might drop, and the escalation rate might be high, suggesting that your frontline agent underperformed. But what if they knew the solution and lacked the authority to execute it - or if your product is fundamentally faulty and there was nothing to be done? That’s why tools like our AI Insights and Conversational Analytics analyze 100% of raw omnichannel interactions to surface root causes and hidden patterns in real-time rather than relying on biased manual sampling of 2-5% of interactions and post-hoc surveys most customers ignore. Be sure to incorporate these for a feedback loop that drives strategic growth directly.
With this in mind, you’re ready to select and perfect your brand’s own set of key customer service metrics.
Customer effort score (CES).
This measures a customer’s perception of how easy your CX made it to achieve their goal. Counterintuitively, a high CES score corresponds to low customer effort - a quirk that many guidelines miss. In fact, a better name might be customer ease score. That’s because it’s collected by asking customers to rank the ease of their experience on a scale of 1 to 7. For your brand’s overall score, calculate the mean:
Sum of all ease ratings / total # of responses
Across industries, companies target a CES of 5.5 or higher. Customers’ outcomes rely crucially on high ease in vital sectors like healthcare and finance, and complications might lead to regulatory repercussions. Similarly, however, low ease is enough to discourage a non-essential purchase, making it just as important in ecommerce etc. That’s why 96% of low-ease experiences lead to customer disloyalty - and why many CX leaders consider CES a better retention predictor than CSAT. Our advice? Closely monitor both.
Net promoter score (NPS).
Unlike CSAT, net promoter score aims to evaluate overall, long-term brand health and proactive advocacy rather than a single support interaction. It’s achieved through asking, ‘How likely are you to recommend our services?’, providing customers with a 1-10 scale where 10 is almost certain. Customers are then ranked as promoters (9-10), neutrals (6-8), or detractors (0-6). NPS is calculated as:
[(Promoters - detractors)/ total # of responses] x 100
Note that your NPS is not a percentage - it’s a number ranging from -100 to 100, with 50 generally considered excellent. However, B2B SaaS’s average is 36-40, retail’s is 64, healthcare's is 46, and financial services often average around 25. That’s why it’s best to benchmark not only against your competitors but your own past performance, introducing Conversational Analytics to surface root causes when you notice a dip.
Expansion revenue.
One of the most obvious bridges between CX and your business’s bottom line is expansion revenue, the additional income your team generates through upgrades, add-ons, premium tiers, and cross-sells. Measure this as:
Revenue from existing customers in the current period - revenue from existing customers in the previous period
The resulting revenue is not only some of the easiest-won for a company compared to courting new customers through expensive campaigns. It’s also how B2B support teams prove to the C-suite that they’re revenue engines, not just operational cost centres. The more directly you can link this extra revenue to specific support actions, the easier it is to formalise and expand successful profit strategies.
Customer retention rate (CRR).
The ultimate lagging indicator of loyalty, customer retention rate is a more direct loyalty metric than any immediate satisfaction check. The formula is simple:
[(Customers at the end of a period - customers gained during that period) / customers at the start of the period)] x 100
In other words, this gives the percentage of existing customers that chose to stick with your brand over a specific timeframe - be it a quarter, a season, a year, or even a decade. In B2B, SaaS, and subscription service models, CRR is the lifeblood of a business, but regardless of niche, retention is what ultimately determines profitability and sustainable business growth.
Typically cheaper than acquisition and leading to lasting revenue, CRR is not only worth tracking, but worth segmenting by customer cohort - e.g. account tier. This enables your support team to identify and save high-value relationships. Even more than experience ratings, however, retention is affected by your products, services, and market dynamics beyond support - so root cause analysis is critical to feed insights back to the correct department and optimise your business strategy.
Customer churn rate.
A dip in retention corresponds to a rise in its inverse - customer churn. Carrying the same importance and limitations as CRR, churn is calculated as its opposite. Simply subtract your retention rate from a full 100%, or measure churn from scratch as follows:
[(Customers at the start of a period + customers gained during that period - customers at the end of the period) / customers at the start of the period] x 100
This gives you the accurate percentage of customers your brand lost over a given duration, accounting for acquisitions to prevent errors. While monitoring churn is essential, by the time this lagging indicator drops, your customer and their revenue are already gone. This is what makes factors further upstream, be they as close as customer ease or as far upstream as agent confidence, critical predictors to tackle proactively before churn enters the picture.
Customer lifetime value (CLV).
What all the above measures are typically intended to maximize, CLV quantifies the total revenue your business can expect to earn from an average customer throughout your entire relationship. Calculate it as:
Average purchase value x average purchase frequency x average customer lifespan
Here, purchase value and frequency stand in for any customer-related revenue your company earns depending on its business model, be it subscription fees or a payout at the end of a ten-year tender. The formula also makes it clear that CLV is a direct function of CRR: if your customers churn at 20% per annum, the average customer lifespan is 100/20 or 5 years. Meanwhile, expansion revenue boosts average purchase value and frequency.
Because exceptional customer experience directly extends this lifespan and drives up purchase frequency through brand loyalty, CLV is the fulcrum of your support team's ROI. Securing and strengthening this connection, however, means piecing apart causality, separating out the impact of marketing campaigns, market dynamics, and CX itself. That’s what makes AI Insights and concrete correlation values between segmented metrics and CLV so critical.
After selecting a strong set of revenue and experience KPIs, it’s time to turn to the operational levers your team pulls behind the scenes to achieve them. After all, even the highest CLV could lag behind a crucial deterioration in agent training that’s poised to turn performance peaks into a PR crisis in a matter of weeks. Efficiency metrics not only cover the speed and quality of your support operations closer to its roots, but also quantify the critical cost component that makes true profitability calculations possible beyond raw revenue figures. These include:
First contact resolution (FCR).
The most immediate connection between customer experience measures and support performance, FCR calculates the proportion of inquiries your team resolves upon a customer’s very first interaction, mathematically:
Tickets resolved on first contact / total contacts x 100
What sets it apart is an undeniable unidirectional impact on satisfaction and NPS. A higher FCR will always boost customer ease and, ultimately, your retention and CLV goals. While the cross-industry average hovers at around 70%, world-class contact centres achieve 80-85% FCR or higher. For a loyalty advantage, that’s what your brand should target. to Seek support teams harnessing automation tech to ensure that every enquiry reaches the most relevant teammate by default, e.g. via our AI-powered Interactive Voice Routing for inbound calls.
Escalation rate.
Many present this as FCR’s inverse. Don’t fall into this common error. An FCR failure might be due to escalation, but it might also represent an inquiry that bounces around within the same support tier or even takes a single agent multiple resolution attempts. Instead, escalation rate can be calculated as:
(Tickets escalated to a higher support tier / total support tickets) x 100
Measuring the proportion of tickets requiring higher-tier support, this represents a major cost driver, in part because Tier 2 and Tier 3 agents typically cost significantly more per minute than frontline Tier 1 agents. It’s also a diagnostic that narrows down shortcomings to a few things: a critical gap in frontline performance, an overly hierarchical resolution authority structure, or faulty routing workflows. Causes tend to differ among complex sectors like tech and stringent BFSI and healthcare support networks, so further analysis is always required when escalations spike. Reduce escalations through continuous AI agent support, including AI Trainer feedback loops and AI Knowledge Assist as well as smarter routing and flexible-yet-secure autonomy distribution to drive down costs and drive up customer ease.
One subtle quirk to note is that improved self-service and bot resolution on routine matters can drive up escalation as more complex issues reach your frontline, so keep considerations holistic.
Average handle time (AHT).
The most misused metric in the industry, AHT tells you how long agents spend on each individual case on average. To calculate it, sum:
(Talk time + hold time + wrap up time) / total contacts
Unlike FCR, boosting AHT doesn’t guarantee an improved experience. That’s because ticket closure doesn’t strictly secure complete resolution. In fact, targeting AHT as a goal rather than a lever causes agents to rush and throw CSAT and NPS under the bus. To catch haphazard AHT before lagging metrics spell revenue already lost, always compare it to FCR. When both move in tandem, your operation is becoming more efficient. Different directions demand an intervention. AI-driven agent support tools reemerge here as the safest way to streamline agent workflow and surface instant answers without sacrificing resolution quality. Check out competitors’ scores, but be careful to benchmark primarily against your operation’s past performance, aiming for steady, secure improvement.
First response time (FRT).
Often confused with FCR, FRT instead measures how long it takes for an agent to respond to - rather than resolve - any given ticket. This is the simple difference between:
Timestamp of first human reply - ticket creation time
Its reliability as a standalone metric falls somewhere between FCR and AHT. A quicker response is always preferred by customers, so long as it’s coupled with competent care rather than stalling. This is especially true in time-sensitive BFSI, healthcare, and B2B logistics, often forming a strict part of Service Level Agreements. Fair targets are an FRT under 1 hour for email, under 60 seconds for live chat, and the 80/20 rule - or answering over 80% of calls within 20 seconds - for voice channels. This translates into a call target of 20-28 seconds.
Lower FRT indicates an overburdened or underproductive team, so investigate further to determine whether improved scheduling, workforce management, or automation and self-service solutions are in order. Clarified routing could once again unburden lines clogged by confused customers.
Average resolution time (ART) and backlog volume.
Average resolution time corrects AHT’s shortcomings by defining successful resolution as your support journey’s endpoint. Calculate it as follows:
Sum of all resolution times / total number of resolved tickets
As with FCR, boosting ART is a direct pathway to improved customer satisfaction and loyalty metrics. Target an ART under 24 hours for general B2C support, and be sure to monitor your backlog volume - the raw count of pending unresolved tickets - alongside it to ensure that hidden delays and seasonal spikes don’t threaten to tank it.
Call abandonment rate.
The proportion of your customers who hang up or leave the queue spontaneously before reaching an agent, call abandonment rate can be a strong predictor of frustration and a lack of faith in your CX. The formula is:
[(Incoming calls - handled calls) / incoming calls] x 100
Lowering this percentage should be an operational priority to ensure that both customers seeking support for the first time and those disillusioned with previous attempts get the opportunity to experience a frictionless, satisfying resolution that builds - or reclaims - brand loyalty. Under 2% is ideal, while an abandonment rate above 5% indicates severe dissatisfaction that requires immediate attention.
If high abandonment is a lagging indicator of historically poor support performance, abandonment can be decreased through upskilling your frontline for stronger FCR. As a leading indicator of future churn, target lower abandonment and higher resolution through both lower FRT and, especially during severe peaks, Automated Callback software that offers customers proactive outreach as soon as an agent becomes available.
Cost per resolution (CPR).
Turning to financial efficiency, cost per resolution is the simple average expense your brand pays for a single resolution:
Total support operating costs / total issues resolved
Take care to distinguish this from an isolated, traditional cost per contact (CPC) measure that fails to account for resolution speed. A low CPC could stem from rushing each of a long series of resolution attempts that ultimately cost much more than a thorough, fairly-timed first-call resolution. Even if the former sums up to less time overall, the compromise in CX quality and customer loyalty will cost your brand far more in the long term. Instead of pressurizing agents, investigate inefficiencies at their root and introduce refined workflows and technology to cut CPR while raising FCR. This is just one instance highlighting the importance of your team dynamic, tech, and the interaction between the two.
While customer-facing and efficiency metrics paint a picture of your current success, what lies even further upstream in determining CX success is the combination of agent experience and technological capability. Tracking support team health alongside modern AI solution performance acts as your ultimate set of leading indicators. Monitored closely, these allow you to predict and prevent efficiency bottlenecks and client-facing blowouts long before a live customer is ever put at risk:
Agent occupancy and utilization. A “Goldilocks” metric defined by a happy middle ground rather than constant boosts, agent occupancy measures the percentage of time agents spend actively handling customer interactions - as opposed to online and available. Calculate it as:
(Total handle time / total time logged in) x 100
The sweet spot for agent occupancy sits squarely between 85% and 90%. While it might be tempting for resource planners to push for 95% or a full 100% in the pursuit of perceived efficiency, doing so is a critical error. Maximising utilisation eliminates the necessary breathing room between calls, triggering severe agent burnout, rising absenteeism, and a resulting crash in your CSAT and FCR. Automation and self-service play a powerful role here - allow agents to experience the benefits of the time these tools alleviate, be this to decompress or upskill.
Agent turnover rate and employee satisfaction (ESAT). Through the quality of agents’ attitudes during customer interactions, internal culture connects directly to external revenue. The importance of retaining skilled, empathetic, brand-expert representatives makes your agent turnover rate a critical hybrid metric, calculated as:
(Agents who left during a specific period / average number of agents during that period) x 100
This figure is a powerful indicator of the cost of a poor internal environment, considering that replacing a single support agent typically costs a business anywhere from 100% to 150% of that employee's annual salary. That includes recruitment, onboarding, lost productivity, and the temporary dip in CSAT while new hires get up to speed. While the customer service industry is notorious for average annual turnover rates hovering between 30% and 45%, aim for world-class support operations actively targeting an annual attrition rate of 20% or less to prevent expenses and craft CX that truly differentiates your brand.
To diagnose culture degradation before it leads to churn, your brand must actively track employee satisfaction or ESAT through regular pulse surveys, calculating the score much like its CSAT equivalent:
(Positive employee responses / total survey responses) x 100
When tracking ESAT, healthy contact centres aim for a baseline of 75% to 80% positive sentiment. Part of keeping this metric high and reducing turnover costs stems from maintaining competitive compensation rates, career development opportunities, and, especially in a field as emotionally taxing as tackling highly-sensitive support requests, maintaining a positive, collaborative environment. Another is investing in streamlined workflows, authoritative knowledge bases, and efficient training to prevent frontline anxiety and empower agents through consistent success.
Solutions like Transcom’s AI Agent Trainer serve as game-changing retention tools here, accelerating agent confidence through realistic simulations and providing ongoing, gamified feedback to encourage growth. A team fully equipped to succeed before they ever face a live, frustrated customer, and improved by every contact they tackle, converts ESAT into CSAT and, ultimately, profitable growth.
AI containment and automation rates. As support ecosystems evolve, tracking the performance of your automated solutions becomes just as critical as monitoring your human workforce. The primary measure here is your containment rate, representing the percentage of interactions resolved entirely by self-service or AI without any human intervention. The formulae include:
(Total inquiries resolved entirely by bots / total interactions resolved) x 100
and
(Total inquiries resolved through self-service / total interactions resolved) x 100
The former is easier to measure, while self-service can be harder to track when forums and FAQ visits are involved - with click-through rates often treated as a proxy. Either way, in combination, modern support centres should target 20% or higher for contact-free resolution on routine queries, with highly transactional e-commerce typically pushing closer to 40%. To optimise this further, track intent recognition accuracy and live agent handover rates alongside basic containment. Industry leaders expect their natural language processors to hit 85% to 90% accuracy in correctly categorising a user's initial prompt. Monitoring this helps you pinpoint the exact knowledge gaps in your LLM and self-service resources. It also ensures that when escalations do happen, they are smooth, context-rich, and effortless for the customer.
A final reminder: the automation paradox.
Stay attuned this counterintuitive quirk of the modern contact centre: as your AI containment rate increases and successfully deflects all the simple, repetitive inquiries - such as order tracking or password resets - your human FCR may actually drop, coupled with a rise in human AHT. This is not a failure of your human team. It simply means that only the most complex, multi-touch, and emotionally demanding issues are now reaching live agents. As your AI capabilities mature, your human operational benchmarks must be proactively adjusted to reflect this new, highly specialised workload - as should the AI tools you provide to strengthen live agents’ performance rather than replace it.

Created at Fri Sep 11 2026
3 min read
This is an interesting thought experiment that is worth exploring for anyone involved in buying or selling enterprise services. Think about two companies in your industry that essentially offer the same services, but in an entirely different way. Banking is a good example. There are several European banks that have been continuously operating for almost 300 years. You can imagine how some of these bank branches look. I

Created at Fri Sep 11 2026
16 min read
When a single negative interaction sends more than 50% of customers to a competitor, CX is make-or-break for every brand. From goal and lever metrics to leading and lagging indicators, experience stats like customer satisfaction (CSAT) and net promoter score (NPS) to efficiency measures like average resolution time, team health factors, and even AI-powered customer service KPIs, learn everything you need to track to assess your customer